.png)
There's no shortage of alarming headlines about record-low snowpack impacts – from historic drought declarations to Colorado River negotiations in crisis. But statewide numbers only tell part of the story. The basin-specific dynamics, elevation profiles, and rain-versus-snow splits are what water managers actually need to act on, and that's where the picture gets both more nuanced and more useful. With snowpack largely written for 2026, the window to get ahead of summer supply decisions is now – not after runoff peaks. That's exactly what HydroForecast provides: not just hydrologic forecasts, but a granular, elevation-resolved view of what's happening in your basin.
The 2026 water year is shaping up to be one of the most difficult on record for much of the Western United States. Across California and the Colorado River Basin, a warm winter and a punishing spring heat wave have left snowpack in a state that can’t be characterized as anything other than dire.
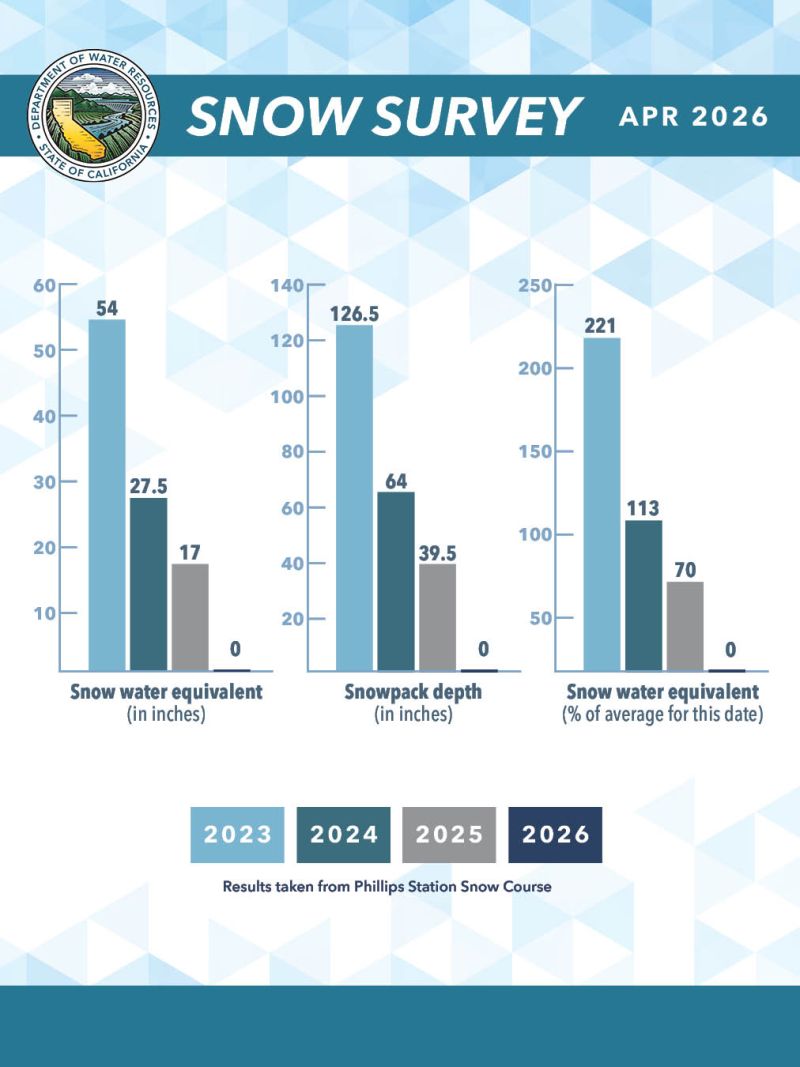
At the April 1 snow survey at Phillips Station in the Sierra Nevada, often an indicator for California’s water supply outlook, there was no measurable snow found. It was the second lowest April reading on record. Statewide snowpack came in at just 18% of average. In the Northern Sierra, home to the state's largest water supply reservoirs, the snowpack was at a staggering 6% of average. DWR's Snow Surveys manager noted that while many parts of the state received near-average precipitation, much of it fell as rain rather than snow.
The culprit this year is not simply a lack of precipitation, but rather an early onset of melt driven by sustained warmth. This is a dynamic that some experts have framed as a longer-term structural shift. As precipitation variability increases and snowpack water storage decreases, snow will no longer buffer California's wet-dry extremes the way it historically has. This year is a vivid illustration of that dynamic playing out in real time. This is a continuing trend — a 2022 California state assessment (OEHHA) found that the rain-snow transition elevation on the western slope of the Northern Sierra Nevada has shifted upward by roughly 1,200 feet since the 1930s.

The picture in Colorado is similarly grim. The chart below, showing Snow Water Equivalent (SWE) across the state, illustrates just how far below normal the 2026 season is. By late March, snowpack across the basin was sitting at roughly 35% of median, with 71 of the state's 92 active SNOTEL stations reporting their lowest values on record. Colorado state climatologist Russ Schumacher described conditions as the most severe since SNOTEL data began in the early-to-mid 1980s.
Some individual basins are faring even worse: Denver Water reported the South Platte Basin at just 4% of normal as of early April, the lowest on record, and declared a Stage 1 drought requiring a 20% reduction in water use across its service area of 1.5 million people. In a recent conversation we hosted with water managers from across the West, Taylor Winchell from Denver Water confirmed he’s seeing the trends first-hand: “We’re seeing earlier melt — a week, sometimes even two — and less of the snowpack translating into runoff than we would have expected before.”
This comes at a particularly fraught moment for Colorado River negotiations. The seven basin states have now missed multiple deadlines to agree on post-2026 operating guidelines, and the federal government has signaled it may impose its own framework.

For California and Colorado, two states deeply enmeshed in Colorado River negotiations and already operating under long-term aridification, the stakes attached to forecast accuracy have never been higher.
As IEEE Spectrum reported earlier this month, machine learning (ML) techniques are already outperforming traditional methods for key reservoirs operated by federal agencies. Last year, we began working with U.S. Bureau of Reclamation to explore and improve short-term probabilistic streamflow forecasts for western reservoirs using HydroForecast, our ML-driven hydrology model. As Reclamation's water availability research coordinator told E&E News, "The better knowledge we have of what's yet to come, the better decisions we can make to allocate water."
But it is not the same story everywhere. Parts of the Pacific Northwest (PNW) are seeing average or near-normal snowpack for this time of year, though there is some variation by elevation. In many watersheds in the PNW, seasonal SWE looks close to average in aggregate, but with a different elevation profile than water managers might be accustomed to working with. That nuance matters for runoff timing and summer flow projections, and it underscores why basin-specific, elevation-aware analysis is more valuable than headline state-level comparisons.
Regional snowpack headlines this year are telling two very different stories depending on where you look. Even within a basin, the aggregate number can obscure what's really happening. In Colorado, most basins are at or near the bottom of the 40-year record. In parts of the PNW, totals are close to normal in aggregate but skewed toward higher elevations, which shifts the melt curve in ways that don't show up in a single SWE number. This variability isn't just interesting context, it's operationally decisive.
To support situational awareness across this year's unprecedented conditions, we’ve added new SWE analysis capabilities powered by the SWANN data from the University of Arizona. The analysis tool makes it straightforward to see how current snowpack compares to historical averages, how this year stacks up against past years including notable highs and lows, and where SWE is above or below normal broken out by elevation band.
The HydroForecast dashboard can now better translate the regional trends we've seen across the West into actionable, basin-specific insights. The example below illustrates this well: even as an atmospheric river brought increased flows to one basin, HydroForecast was simultaneously capturing the well-below-average snowpack that defined February conditions. Paired with data like SWE by elevation band, the dashboard offers a complete picture of what's driving dynamics in a specific basin.
.png)
The pressing question now is how summer flows will be affected — how quickly the remaining snowpack translates into runoff, and what that means for reservoir storage heading into the dry season. It's exactly the kind of question HydroForecast is built to answer — with the granularity and lead time that practitioners who are operating on the frontlines of a shifting water landscape actually require. As Taylor Winchell from Denver Water said, “Streamflow forecasts are an extremely important component of our planning toolkit… and with that, it’s important to understand snowpack dynamics, soil moisture, and total precipitation — like what is behind HydroForecast”
Talk to our modeling experts about the conditions your basin is seeing this drought season and how to start positioning for summer supply.