In the world of hydrology, a basin’s streamflow response from rain-on-snow events can be particularly difficult to predict. These can be critical events for water managers, hydropower generators and other water system operators because they can cause unexpected runoff events and indicate the start or end of the snowmelt season, both of which need to be closely managed.
HydroForecast’s unique combination of physical and statistical modeling approaches in a neural network framework has created a model that is better able to handle the uncertainty of rain-on-snow events and provide more accurate forecasts to customers to help de-risk their operational decision-making.
North Fork American River at North Fork Dam, CA.

Spring 2022, specifically the peaks between April 16th to the 26th.
In late April 2022, a rain on snow event occurred in the NF American basin that coincided with peak spring runoff. Rain on snow events occur when rain falls on an existing snowpack. Depending on the temperature during the event, the rain can freeze and form an ice layer on the snow that will become runoff, or combine with the snow and accelerate melting. The challenge is predicting how much of the rain will freeze and add to the existing snowpack, and how much will result in runoff at the time of the precipitation. This can be tricky for a forecasting model to capture because if the temperature forecast is slightly too high or low, the model will interpret the precipitation incorrectly. HydroForecast is built to hedge against this situation by integrating multiple weather forecast sources, which the model uses to make the best prediction it can given the uncertainty in the inputs.
In mid-April 2022, much but not all of the snowpack had melted and SNODAS data reported an average of two inches of snow water equivalent across the basin.

The HydroForecast model saw weather forecasts calling for multiple significant precipitation events and air temperatures ranging between 32 and 52 degrees Fahrenheit. All together, this setup a classic, challenging-to-forecast rain-on-snow event. Below are the weather forecasts during the April 16th to 26th, 2022 time period.

In the above graphic, the leading US and European weather models each predicted storms during the 10-day period between April 15th to 25th, but disagreed on the amount of precipitation. They generally predicted daytime temperatures in the 50s and nighttime temperatures close to freezing.
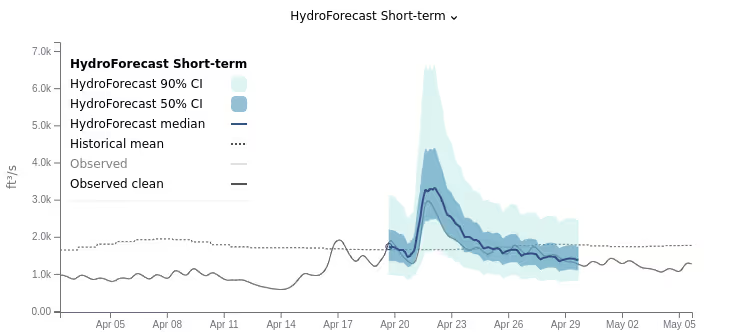
The black observed line in the hydrograph below shows the flows that ultimately occurred. Let’s see how HydroForecast did in predicting this multi-peak rain on snow event.

In the time lapse story below, each of these predictions have the observed line shown for comparison. At the time of the model’s prediction, the observed flow was unknown.
HydroForecast captured the first two events of the rise, but precipitation forecasts for the final peak on April 21st had not yet come into agreement about the final expected precipitation. HydroForecast’s probabilistic predictions showed the potential for the third event and captured the event’s eventual peak within the confidence intervals.

The magnitudes of the peak flows came into focus and the initial two events were well captured. The median prediction for the third event’s peak discharge rose closer to the eventually observed peak.

HydroForecast’s median accurately forecasted the magnitude and timing of peak flows.

The forecast held steady and the tail of the event raised slightly.

Precipitation forecasts were revised upwards which caused a slight over forecast of the peak from HydroForecast’s median. However, the peak was well captured by the 50% confidence interval.
The forecast dialed in. HydroForecast continued to forecast wide confidence bounds during peak flow hours in recognition of the inherent uncertainty of rain-on-snow events.
Forecasts continued to update multiple times per day to track dynamically changing hydrologic conditions which aided smooth operations as the flows receded.

The plot below summarizes the 6- to 1-day ahead percent flow errors for the third peak event, 4/21/22 to 4/22/22. These errors were calculated by taking an average (in CFS) of the observations and our forecasts for these two days, then computing the percent error. Since we issue forecasts twice daily, the “0.5” increments are the afternoon forecasts.

HydroForecast’s unique combination of physical and statistical modeling creates a powerful tool for water managers to de-risk decisions leading up to difficult-to-forecast events such as rain on snow. Moreover, its neural network core enables it to assess a wider breadth of factors such as SNODAS and MODIS satellite data, along with multiple weather forecasts, and weight each factor to present as accurate a forecast as possible.
If you’re interested in learning more about HydroForecast’s capabilities and wish to view other examples, visit our forecasts page or get in touch with us today.