.png)
We've all stared at a weather forecast, wondering whether to trust that 30% chance of rain. When uncertainty is in the forecast, one person might cancel their plans while another packs a rain coat. Without realizing it, we engage in probabilistic thinking daily: we weigh the likelihood of different events when planning ahead, then act based on how much risk we're comfortable with.
When it comes to water forecasting, the the earth system's inherent uncertainty demands a risk-aware approach. That’s why we built HydroForecast to be a probabilistic model, allowing users to consider a range of possible events. Here, we’re breaking down how HydroForecast visualizes uncertainty to help you implement strategies that drive resiliency, efficiency, and better business outcomes.
HydroForecast is a probabilistic model, which means it provides a distribution of likely outcomes, each tied to real-world uncertainty, rather than a single deterministic forecast. This approach allows us to more accurately communicate the natural complexity of weather, hydrology, and the countless interacting variables that inform our streamflow forecasts — including rainfall, snowmelt, temperature, soil saturation and more.
Rather than resisting this inherent uncertainty with false precision, we show a spectrum of possible outcomes to empower operational, financial, and safety decisions. With weather forecasts being an essential input into HydroForecast, the reality is that our model integrates multiple forecasts that don't always agree. This is where probabilistic forecasts really shine. By presenting a distribution of likely scenarios, HydroForecast helps decision-makers better assess and mitigate risk.
Obtaining the reliable data required for this risk assessment is often one of the biggest challenges of the water professionals we work with. and understand the challenges they face — financial losses, operational disruptions, or safety concerns. However, they often lack the reliable data needed to support their strategy. Our role is to close that gap with industry-leading accuracy.
HydroForecast visualizes streamflow uncertainty as confidence intervals — shaded bands around a central mean forecast line.
In short, wider bands mean more uncertainty, while tighter bands signal higher forecast confidence.
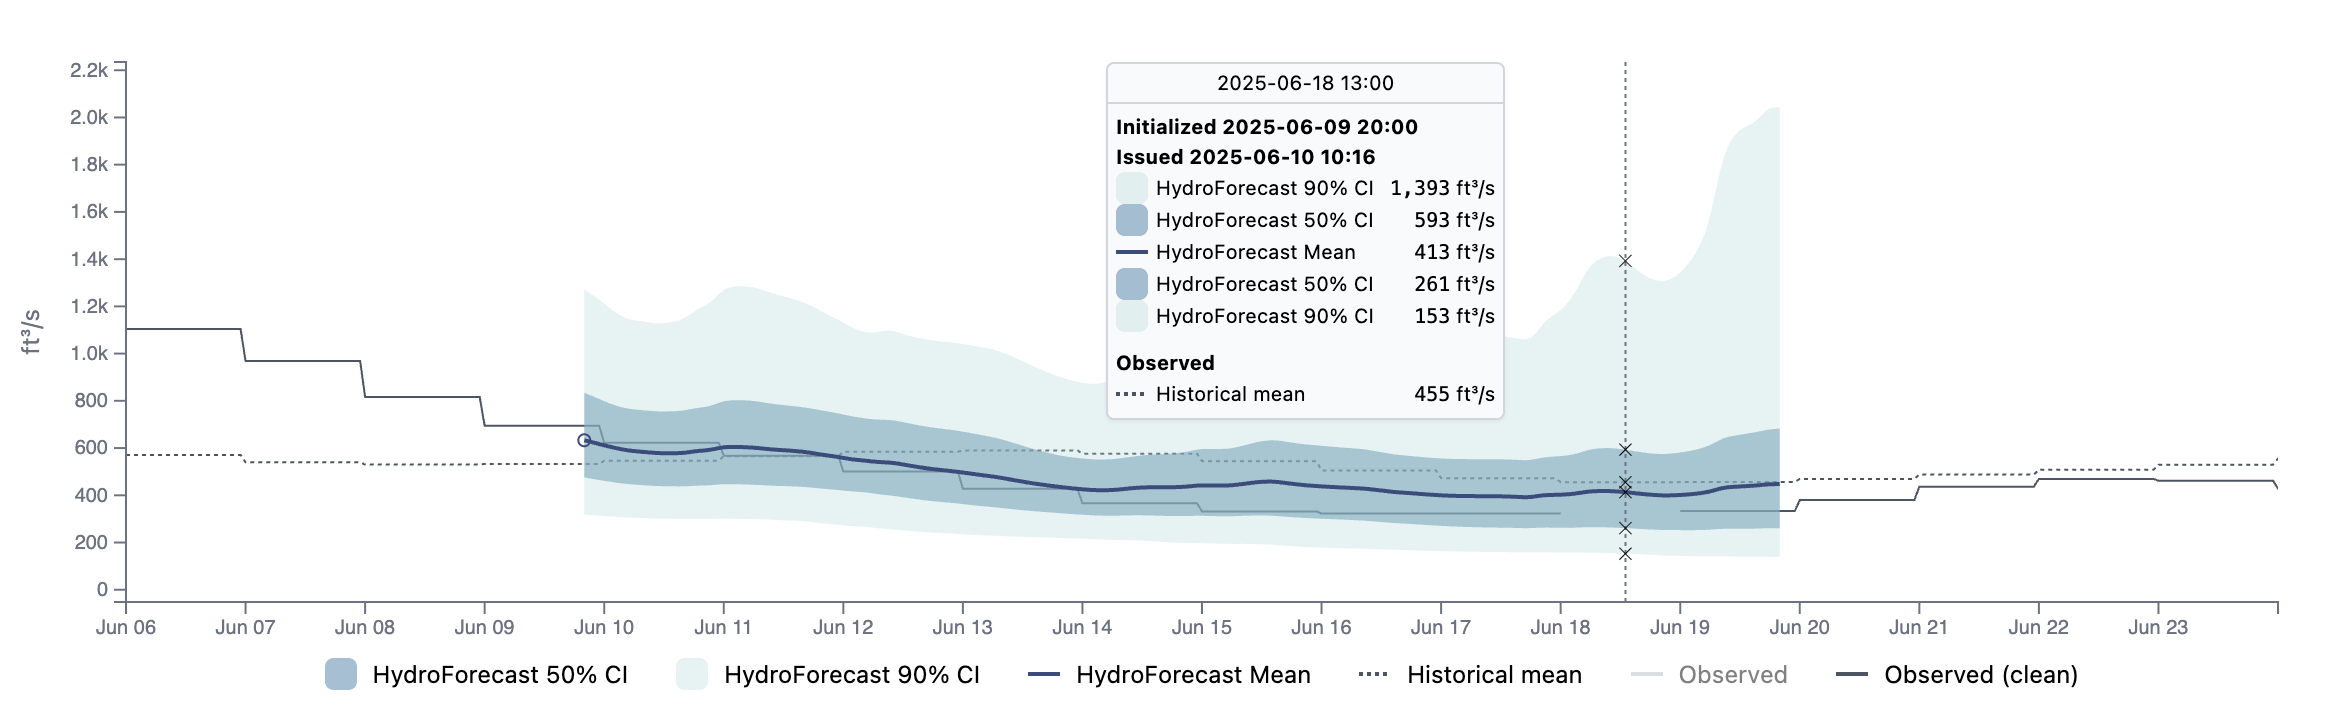
>> Find more information on interpreting confidence intervals in the HydroForecast Knowledge Base.
Moving beyond single-point forecasts requires a systematic approach to interpreting and acting on uncertainty. Here's our recommended framework for using confidence intervals to transform workflows once reliant on static predictions into dynamic risk management:
Over years of working closely with teams from across water sectors and seeing first-hand the nuanced decision-making our customers engage in, we’ve continually refined HydroForecast to support real-world risk analysis in many industries.
For example, both hydropower and river shipping companies prioritize safety, but the nature of their decisions and approaches to uncertainty vary.
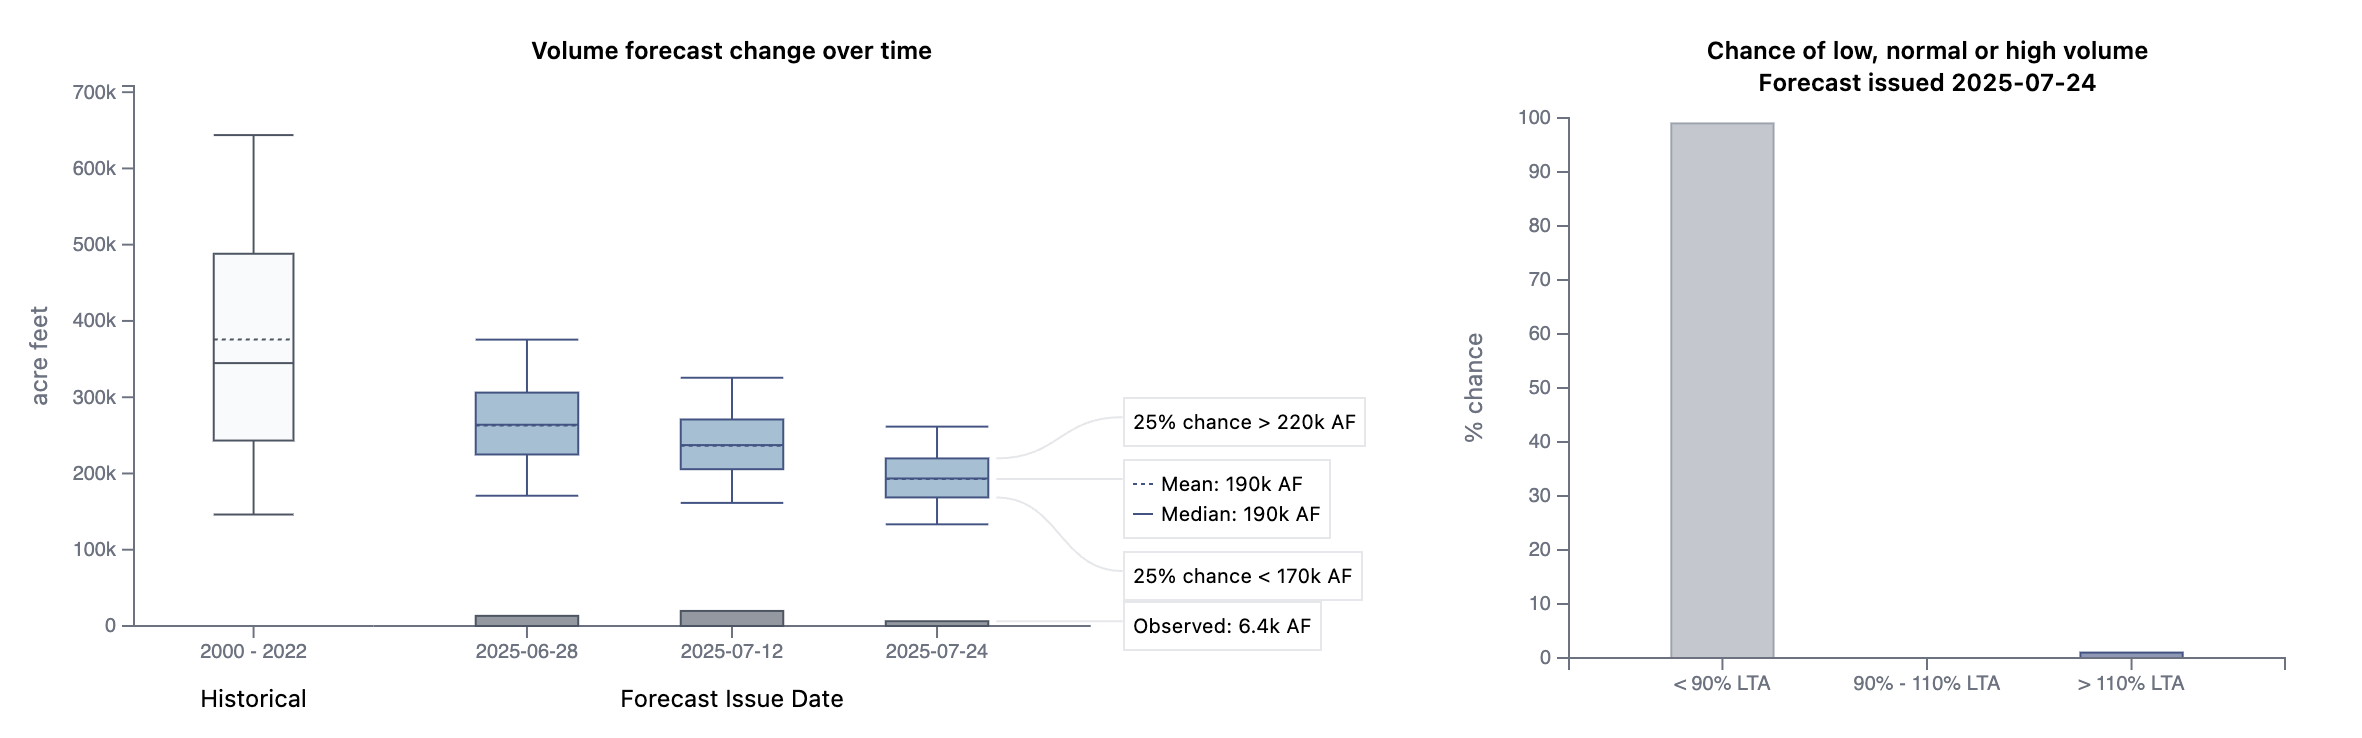
Seasonal planning poses an added layer of uncertainty as there’s more time for conditions to shift and weather patterns to evolve. That’s why we developed HydroForecast Seasonal, an advanced model for longer-range planning. With intuitive charts like box plots comparing current condition to the long-term average and seasonal volume probability charts, users can visualize how forecasts change over time and the likelihood of a wet or dry year with greater clarity for more nuanced scenario planning.
No matter your sector or risk profile, making confident decisions starts with understanding what’s possible. HydroForecast brings clarity to the inherent complexity for water forecasting, helping teams become more strategic and prepared.
Contact our team to get started with HydroForecast.
.png)

.png)