
In the continued quest for more perfect streamflow and water supply forecasts, we often return to the search for better data inputs. In basins where snowmelt dominates the annual water budget—the western U.S. (53%), the Colorado River basin (60-80%), Japan (~30%), and the Swiss Alps headwaters (35%) to name a few—improving snow data and model snow states is a logical place to focus.
Ultimately, the broad water community hypothesizes that better snow data → better model states → improved runoff predictions. This is a reasonable chain of assumptions because hydrology has rules and principles (morals—not so sure!), and even if we cannot fully prescribe all the physical parameters that influence hydrology, snow is a clear enough signal that we know it’s important to correctly represent.
An interesting newer development in this conversation is that the modeling landscape is changing as well. So, while better data is always one piece of the quest, we have a whole new set of models with which to play and experiment. Yes, I’m referring to machine learning hydrology models, which as we’ll explore here, are uniquely capable of learning how to extract skill in a fundamentally different way than existing physical models, and that is leading to advancement in many facets of hydrologic prediction.
Thus in the U.S. and globally, we have invested millions into snow data–from standing up operational gridded models like Snow Data Assimilation System (SNODAS) and Snow Water Artificial Neural Network Modeling System (SWANN), to the collection of high-resolution point measurements like the Airborne Snow Observatory (ASO). While many of the government- related programs started off with large funding investments, they are struggling to keep the resources needed to maintain them.
All these types of snow data have their own unique value.
But the real test comes in determining thatvalue: Are our current hydrologic models able to use the data to make more perfect runoff forecasts? We’re investigating these questions deeply as we continue to innovate with HydroForecast, our ML hydrologic model.
ML research and applications in hydrology have grown substantially in recent years. Objectively, a few seminal works in hydrology have shown consistent skill improvements with ML models across large area studies around the world; e.g., Kratzert et al (2019) in the U.S., Mai et al (2022) in Canada, and Clark et al (2024) in Australia; similarly for extreme events, Frame et al. (2022).
We were a part of the initial Kratzert publications, and are continuing to ask big research questions with our ML hydrologic models, like:
With HydroForecast, we train a foundational hydrologic model (see Kratzert et al. 2024 for why this is critical) to learn hydrology across a diverse set of geographies, hydrologic regimes, topographies, etc. Up until now, snow data has only been one of HydroForecast's inputs after experiments across our foundational model sites showed higher skill with these inputs. We’ll dive into more below, but here’s a teaser: we’re currently testing HydroForecast’s ability to predict snow.
As part of our ongoing R&D experiments to train and improve HydroForecast, we tested the model with and without remote sensing observations as inputs. Our source is the globally available NASA MODIS Normalized Difference Snow Index (NDSI) and Normalized Difference Vegetation Index (NDVI); we ran a few scenarios to understand the impact of these on skill (Figure 1).
.png)
We observe that skill in terms of Nash-Sutcliffe Efficiency (NSE) increases when the NDSI and NDVI are included, and particularly at basins for which the baseline model performs less accurately (NSE < 0.4). Arguably, the interesting part here is that we know NDSI isn’t a great measure of snow–in fact, it's just cover and not depth. Despite NDSI’s limitations, the model learned how to utilize this dataset to extract information that improved its target output: better runoff prediction.
Next, we integrated a really good (proprietary) high-resolution snow dataset to understand its added value on improving runoff forecasts. To set the stage, we’re in the Swiss Alps where we’re forecasting the inflow to Lake Geneva. This is a basin with upstream regulation, glaciers, and about 25 active streamflow gauges to utilize and evaluate.
To evaluate the snow data's impact, we ran the model using re-forecasts of weather data and the proprietary high-resolution snow dataset as a daily input over a two-year validation period. We then calculated Kling-Gupta Efficiency (KGE) and normalized bias to ponder performance, averaging the results over the 1 to 10-day forecast horizon to ensure our metrics were robust.
.png)
Key results and takeaways: The model has learned snowmelt pretty darn well
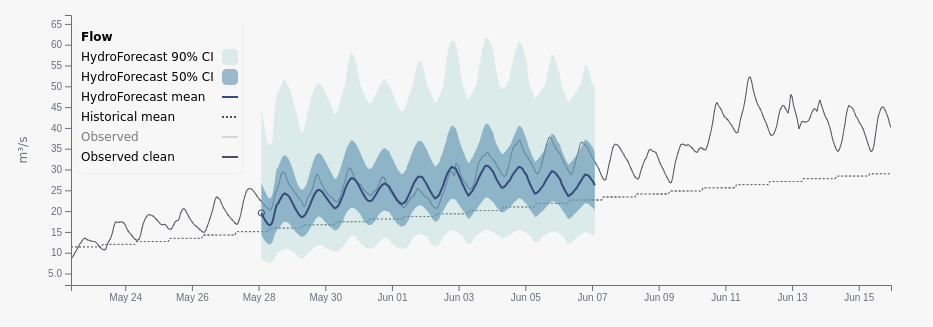
What does this look like for a single site, for a forecast issued in the spring melt period?
Below is an example forecast with the Full Inputs model from a snow-driven site within the Lake Geneva basin. Note the strong diurnal pulsing that’s a signature of snowmelt in the figure below from the model (blue lines and shades) and the observations (black line).
How did the model learn to track pulsing? What inputs is it paying attention to the most? We can look inside the model’s “black box” and learn which features it is valuing highest. Apologies for the many acronyms of weather data below!
.png)
The inputs the model is paying most attention to are what we expect: snow-related data. The third is temperature, another critical input during snowmelt, and so on…
Zooming out from a single-issued forecast, we can look at the history of predictions at this site and isolate the high-res SWE input to understand when the model started paying attention to it. In this case, the first signal of ‘importance’ came five months before the peak melt occurred.
.png)
Intuitively, it makes sense that the model starts paying attention to SWE as it is accumulating, and that signal becomes more important as the time to melt gets closer. The interesting part here is that when the model has snow cover and SWE data, it uses this data as we expect. When it does not have it, the predictions are still quite reasonable. What does this mean for scaling ML models across areas that have a heterogeneous amount and quality of snow data?
Obviously we know this isn’t the end of the snow+data opportunities; there’s lots more to dig into here. Luckily this means our work is never done and we look forward to continuing our experiments and R&D with snow data. Here’s a sneak peek into what we’re working on…
In addition to investigating how the model uses snow data, we’re working on two big pieces of R&D for HydroForecast.
I’ll keep everyone updated once we’ve interrogated the models completely and are confident in the findings! Feel free to reach out to our team for more question about HydroForecast and snow data.
.png)
.png)