What my West Coast road trip taught me about environmental tech and climate change.

In August, my partner and I packed up a rental car to move from Vancouver, Canada, to Los Angeles. We considered taking a scenic, meandering road trip on Highway 1 along the Pacific coast. But with only a few days to complete our journey, we opted to take Interstate 5: a straight shot across the flat and hot Central Valley of California.
Taking “the Five” provided a close-up view of many environmental challenges I work on every day at Upstream Tech. Our team focuses on improving the pace, scale, and impact of environmental work by making remote sensing technology more accessible - a topic that was never far from my mind during my three days behind the wheel. As we headed south, I saw many opportunities to gain insight from satellite imagery and data, from tracking forest fires to monitoring depleted reservoirs to conserving bird habitat.
While British Columbia’s climate is usually very dry in July and August, this year’s typical summer drought conditions were exacerbated by a record-breaking heat wave in June. The stage was set for a vicious forest fire season. Over 200 were burning across the province the day we departed Vancouver.
Those same dry conditions were obvious all the way through the Pacific Northwest. In southern Oregon, we had our first brush with forest fire when smoke from the Skyline Ridge complex fire in the Umpqua National Forest blanketed the highway. At the same time, the Bootleg Fire was still devastating over 400,000 acres just on the other side of the Cascade Mountains.

Many of Upstream Tech’s partners are concerned about wildfire on the land they manage. So, we’ve been using remote sensing data in our Lens application to explore wildfire risk and impacts. These satellite images from Lens’ vegetation layer show a roughly 10,000 acre area burned by the Bootleg Fire:

The earlier imagery from June was taken before the Bootleg fire started, while the July imagery from a month later was taken after the fire burned in this area. The areas in white denote where little to no vegetation remains after the fire (as compared to green, which denotes high photosynthetic activity and hence active vegetation growth).
This data visualization provides a snapshot of the Bootleg Fire’s damage, showing where trees were more severely impacted. It can also help inform restoration planning. While the scale of the damage may at first seem overwhelming, Lens can help pinpoint less-damaged areas - helping forest managers understand what contributed to their resilience.
Thanks to Upstream Tech’s partnership with Salo Sciences, Lens can also display AI-derived forest data layers that depict wildfire risk, canopy coverage, and surface fuels. While wildfire risk will continue to grow, accessible remote sensing data can put better information in the hands of forest managers to help assess and respond to threats on the landscape.
From Oregon, I-5 passes through California’s northern mountains. The dramatic peaks and rushing rivers made this region ideal for hydropower development in the 20th century. I-5 crosses directly over Lake Shasta, which was created in 1945 when the Shasta Dam was built on the Sacramento River. Although this is the largest reservoir in California, our view from the bridge revealed how unusually low the water levels were.

Later that day, we chatted with our Airbnb host in the small farming community of Princeton. He mentioned that the power plant at the nearby Oroville Dam was just turned off for the first time in its 50-year history. Normally, the dam provides power to 80,000 homes. But with the reservoir at its lowest levels ever, water could not flow through the turbines to generate power. Our host was eager to explain how his rooftop solar panels provided 100% of his home’s electricity needs.
In contrast, in 2017 the Oroville Dam nearly failed when heavy winter storms filled the reservoir and caused two of its spillways to collapse. Even though the dam was over 30 miles away from where I was standing, its impoundment could hold enough water to cover the entire region of Princeton in several feet of water if it were to suffer an uncontrolled release.
With climate change accelerating, such extremes are becoming more common. This makes it extra challenging for water managers and policymakers to get the information they need to manage freshwater supplies for both ecosystems and human needs. Upstream Tech’s HydroForecast team has been working to address this need in California’s nearby Trinity River basin.
HydroForecast uses satellite and meteorological data to predict snowpack levels and the resulting streamflow earlier and more accurately. HydroForecast’s model can flag when abnormally high snowpack levels pose risks of floods or dam failures. It can also predict when low snowpack will cause or exacerbate drought conditions.

For reservoirs like Shasta and Oroville, HydroForecast’s remote sensing functions can help planners decide how to allocate water - from agriculture to hydropower to fish habitat needs. The more efficient management of water will be crucial in an increasingly unpredictable climate.
Somewhere in the dusty grid of country highways connecting Princeton to I-5, we slammed on the brakes. Smoke from the Dixie Fire (the second largest in California state history) had blown westward off the Sierra Nevada Mountains, blanketing the Central Valley in an orange and brown haze. Yet surprisingly, a flock of interesting birds emerged in the irrigation ditch that separated the road from the surrounding rice fields.
Binoculars at the ready, I whipped out Cornell Ornithology Lab’s “Merlin” bird app to confirm what I was seeing: great egrets, killdeer, and - a first for me - black faced ibis and cattle egrets. I was thrilled! Two lifers, spotted under a smokey red sun in a landscape of endless, uniform rice fields.

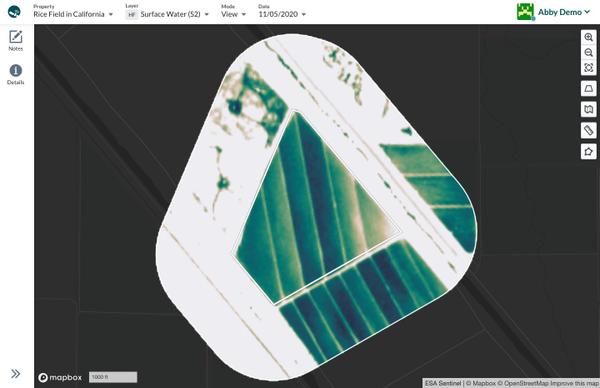
I should credit some of my good luck to The Nature Conservancy in California’s (TNC CA) BirdReturns program. The Central Valley is a key flyway for Pacific migratory birds, supporting millions of ducks, geese, swans, and shorebirds. However, due to extensive industrial agricultural development throughout the 1900s, less than 5% of historic wetland habitat remains. BirdReturns incentivizes rice farmers to flood their fields during migration to provide “pop-up” wetland habitat for these birds.
Yet in California’s vast agricultural landscape, it is challenging for TNC CA to rely solely on on-the-ground data collection to monitor the thousands of acres of fields they enroll in the program each year. So, TNC CA uses Lens’ high frequency data visualizations of surface water levels from the Sentinel-2 satellite, which are captured every week. This ensures that all the required fields have been flooded to the right depth at the right times.
By using remote sensing to complement on-the-ground data collection, TNC CA can scale up the number of acres they enroll in the program while still ensuring the program’s effectiveness.
Soon after we arrived in our new home in Los Angeles, the Intergovernmental Panel on Climate Change released its Sixth Assessment Report. The report predicted severe consequences from climate change if action is not taken. Our road trip was just a preview of the extremes we’ll likely experience as climate change accelerates.
More than ever, we need new tools for understanding and responding to climate change’s impacts on the landscapes and water systems that support us. Satellite monitoring can provide a useful source of information for making these tough decisions. Upstream Tech’s Lens and Hydroforecast make this data more accessible and easy to interpret - tapping into the power of technology to inform natural resource management.