By incorporating a range of data sources from satellites and ground sensors, our machine learning models rapidly calculate short- and long-term streamflow forecasts with unprecedented accuracy.

By incorporating a range of data sources from satellites and ground sensors, our machine learning models rapidly calculate short- and long-term streamflow forecasts with unprecedented accuracy.

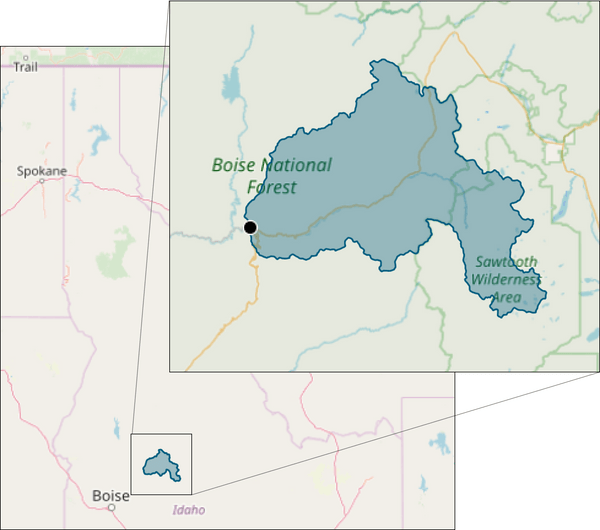
This case study explores how HydroForecast™ works using short-term forecasts at the South Fork of the Payette River in Idaho.
The South Payette River drains 1,200 square miles (3,100 km2) of central Idaho mountains and valleys, including the striking Sawtooth range. Its flows support river rafting and hydropower operations.
Spring snowmelt drives the river’s highest flows. In this case study, we’ll do a deep dive into HydroForecast™ during the 2019 snowmelt period.
First let’s begin with our forecasts. This plot shows HydroForecast during the Spring 2019 snowmelt period. The black line shows the true observed flow and the purple line and colored bands show what our model forecasted 24 hours ahead. HydroForecast™ is able to provide its confidence along with each prediction providing deeper insight into future flows.

HydroForecast accurately forecast the spring snowmelt. The table below displays our model’s Nash Sutcliffe Efficiency (equivalent to R2) for forecast horizons reaching ten days ahead during the spring period plotted above.

Two features of our model enable it to forecast as accurately as it does. First, we use near real time satellite observations of snow, vegetation, land surface temperature and more to provide our model with the most up to date observations of the basin possible. Second, our advanced neural networks have learned the fundamental hydrologic relationships to turn those satellite observations into accurate forecasts.
Most hydrology models attempt to track conditions in the basin like snow water equivalent by modeling snowfall and melt. We give our models a leg up by providing direct satellite observations of key processes like vegetation growth, snow cover and melt, soil moisture and more.
The examples below show the rapid progression of snowmelt and vegetation growth in the South Payette River Basin at three selected times in the spring. The data is a false color map of a satellite indicator of vegetation and snow presence. Here we use darker green for healthy vegetation, brown for bare ground and thin snow and white for deep snow.

We have built additional tools to validate our snow inputs using high resolution satellite imagery. The color imagery below shows a slice of the south-eastern end of the basin comparing the snow-covered mountains on April 19th, 2019 with the dry peaks of August 27th, 2019.

We take a theory-guided data science approach to hydrologic forecasting, drawing from the deep history of hydrologic science to inform data driven models. Our forecasting model is built on a state of the art neural network algorithm called Long Short-Term Memory (LSTM) which is particularly suited to modeling dynamic systems over time and learning from a vast amount of satellite, weather, and land surface data. We augment the model’s ability to learn physical laws of hydrology with a theory driven evaluation of the logic and correctness of the relationships it has learned. In other words, we like to know how the model creates its forecast and what are the main drivers.
We can analyze the drivers of discharge at any time of the year by tracking input contributions (past and present) to the predicted discharge. In this example, we focus on a period of rapid snowmelt in South Payette River basin, specifically the 10 day period from May 5th through 15th.
The first plot shows a subset of important inputs to snowmelt processes. The second plot shows each input’s relationship to the amount of discharge: a positive value means the input on that day contributed to more discharge during May 5-15. Note that we see no contributions from any input after May 15th - the future cannot affect the past.

There are two things to notice in the input contributions plot. First, precipitation during storms in February through April is positively correlated with discharge during May 5-15. In other words, there will be more snow to melt in May because of those storms. By observing historic data, the model has learned to look at other inputs like air temperature (tmp), day and night land surface temperatures (lst) and humidity (hum) to determine if precipitation has fallen as rain or snow.
Second, the model not only understands how much snow there is, it also understands that when there is snow, solar radiation turns that snow into runoff. That connection is represented by the strong positive contribution of solar radiation (srad) at the beginning of May. Indeed we can see this rapid snowmelt caused by high solar radiation using remotely-sensed data in the “The Role of Satellite Data” section above.
Taken together, we see how the HydroForecast neural network has successfully learned the physics of snowfall and snowmelt in the South Payette River basin and accurately predicted spring runoff.
That concludes our case study of HydroForecast at the South Payette River. If you’d like to learn more about HydroForecast or see what it can do in your basin contact team@hydroforecast.com.